Blog posts
- Airport info API 14 Dec 17
- Admin dashboard hacks 01 Nov 17
- Allow visitor to change skin 24 Oct 17
- Weather and sunrise/sunset 03 Oct 17
- How to create a chatbox 27 Sep 17
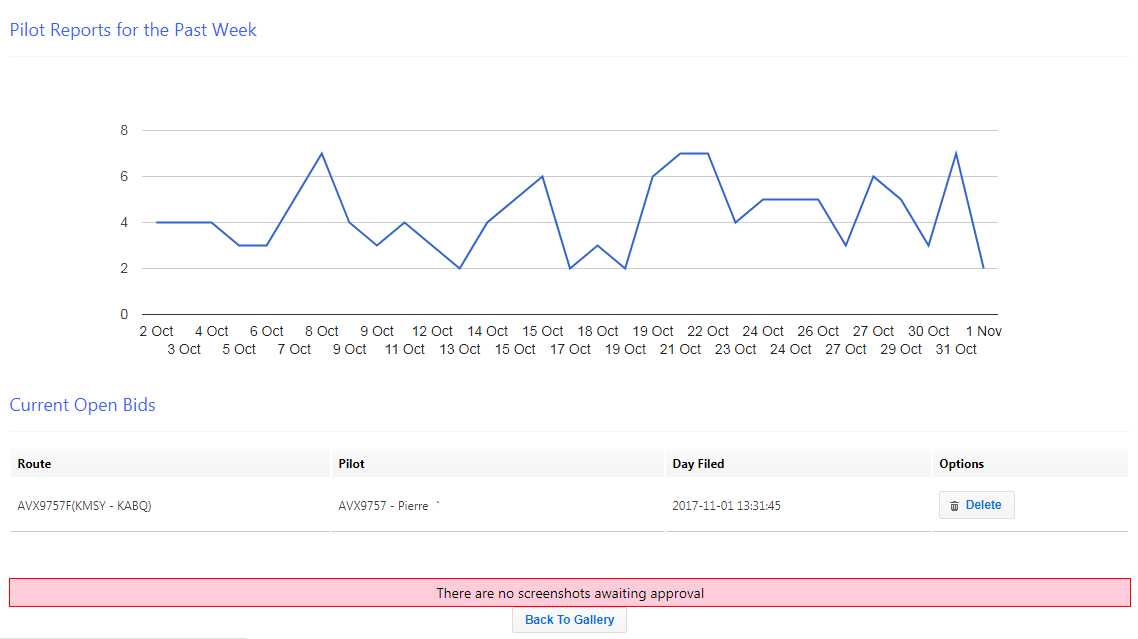
The standard PHPvms admin dashboard is a bit of a dog: the line graph, based on shockwave flash, was hacked a few years ago, and the "Latest news" never shows any news. So here are some tips for improvement.
Open up /admin/modules/dashboard/dashboard.php and add the following to the index function, before $this->render
$this->set('pireps', PIREPData::getIntervalDataByDays(array(), 30));
$this->set('allbids', SchedulesData::getAllBids());
$this->set('screenshots', ScreenshotsData::getscreenshots_toapprove());
You can change the 30 to however many days you want to show up on your graph.
The third line only applies if you have the screenshot/gallery module installed. If you do, you must copy screenshots_approval.tpl to your /core/admin/templates folder!
Next, open up the file /admin/templates/dashboard.tpl or php. Look for the lines after "click here to send them", approximately line 36. After the } that ends the block, paste this:
Template::Show('pilots_viewallbids.tpl');
Template::Show('screenshots_approval.tpl');
IMPORTANT: If you use the php version, you should change .tpl to .php
Last but not least, go to the end of the script where it says: Don't need to change anything below this here. Well you'll have to if you want a nice graph! Delete the entire script block and replace it with this:
<script type="text/javascript" src="https://www.gstatic.com/charts/loader.js"></script>
<script type="text/javascript">
  google.charts.load('current', {'packages':['corechart']});
  google.charts.setOnLoadCallback(drawChart);

  function drawChart() {
    var data = google.visualization.arrayToDataTable([
      ['Day', 'Pireps'],
	<?php
	$counter=0;
	$total=0;
	$len = count($pireps);
	foreach($pireps as $row)
	{
		echo "['".date('j M',$row->timestamp)."',".$row->total."]";
		$total=$total+$row->total;
		if ($counter<$len-1)
		{ 	echo ","; }
		$counter++;
	}
	?>
    ]);

    var options = {
      title: '',
      legend: { position: 'none' }
    };

    var chart = new google.visualization.LineChart(document.getElementById('reportcounts'));

    chart.draw(data, options);
  }
</script>
Then upload the dashboard template to your server and check everything is working. If the graph looks a bit flat, you can change the height of the div:
Once everything is working, your admin panel should look like the screenshot below